Admission Dashboard
Introduction
The Admissions Dashboard of the EnrollX module provides a comprehensive view of the admissions data for faculty members. It visualizes key metrics to track the progress and trends in the admissions process for different programs and batches, facilitating informed decisions and actions.This guide provides a step-by-step process for viewing required data metrics in Admissions Dashboard within the EnrollX Platform.
Getting Started
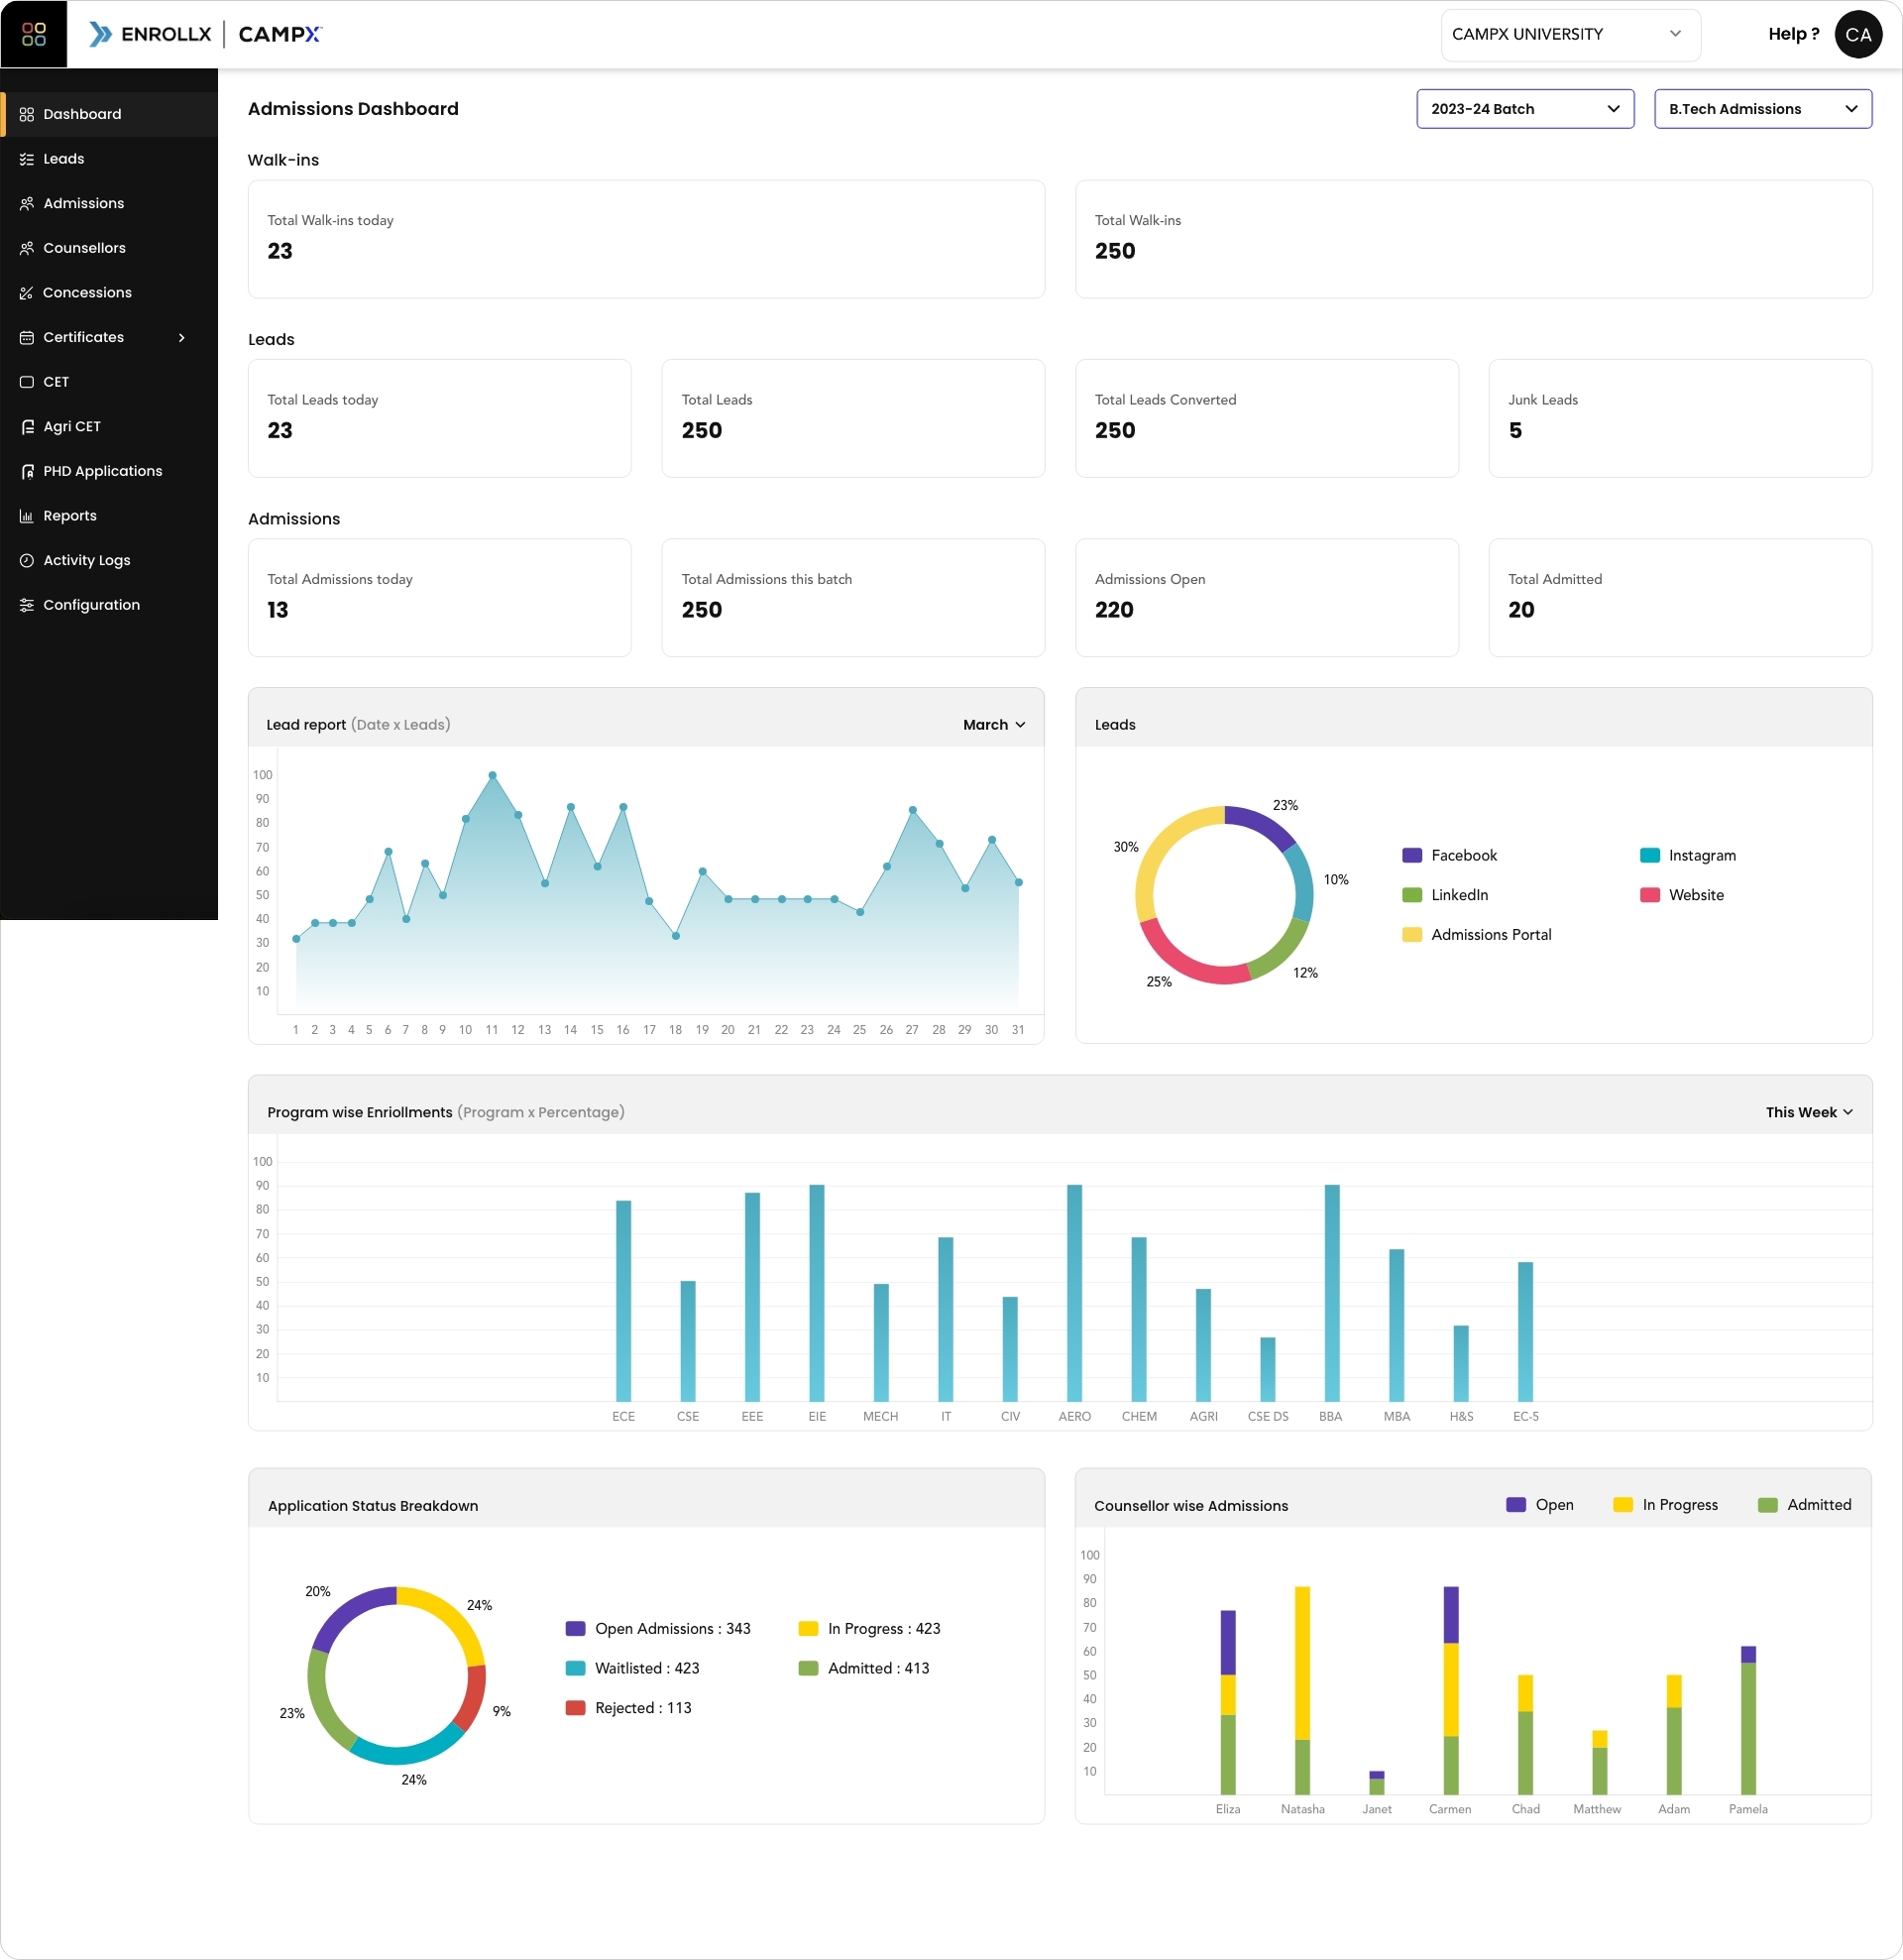
To begin managing Admissions Dashboard, here’s how to navigate:
- Sign in to your CampX account and access EnrollX app.
- Click
Dashboardon the EnrollX Sidebar. - View the list of predefined Lead and Admission Metrics in the
Dashboard.
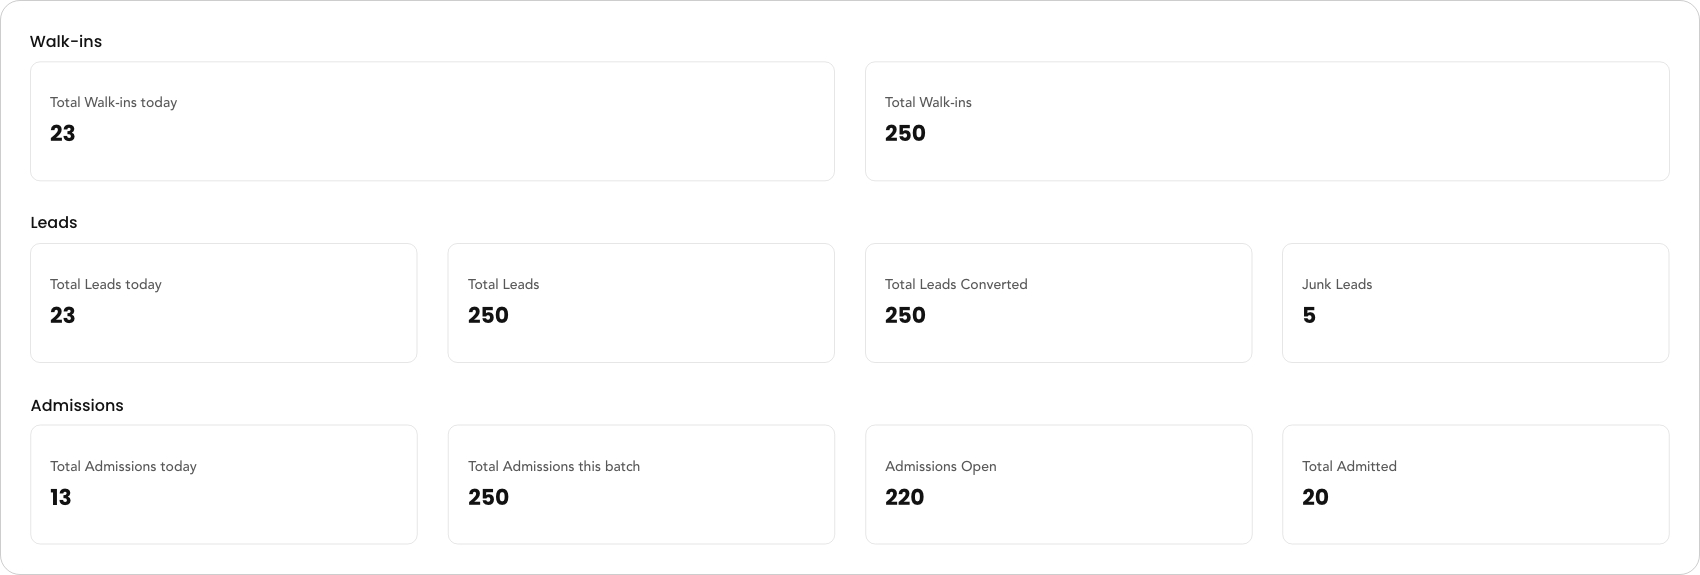
Definition of Each Metric in the Dashboard:
- Total Walk-in Leads Today: The number of prospective students who visited the campus today without prior appointment.
- Total Walk-in Leads: The cumulative number of walk-in leads to date.
- Total Leads Today: The total number of new leads generated today from all sources.
- Total Leads: The sum of all leads accumulated over time.
- Leads Converted (Moved to admissions): The number of leads that have been successfully converted into admissions.
- Junk Leads: Leads that have been determined as unproductive or irrelevant.
- Total Admissions Today: The count of new admissions processed today.
- Total Admissions: The total number of admissions to date.
- Admissions Open: The current number of admissions that are still being processed.
- Total Admitted: The total number of students who have completed the admissions process and are enrolled.
Visual Reports on the Dashboard:
-
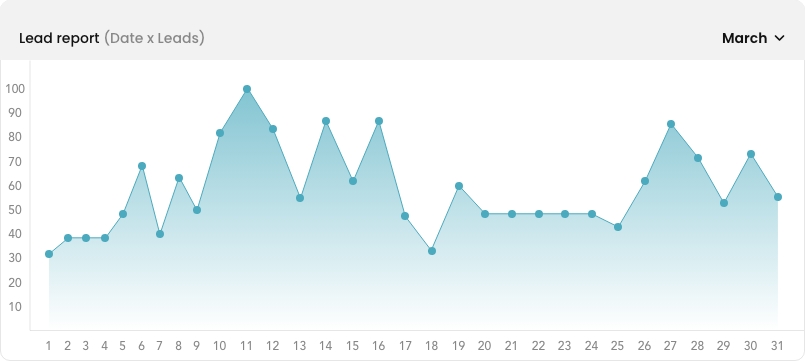
Lead Report by Day: A line graph showing daily leads over the month.
-
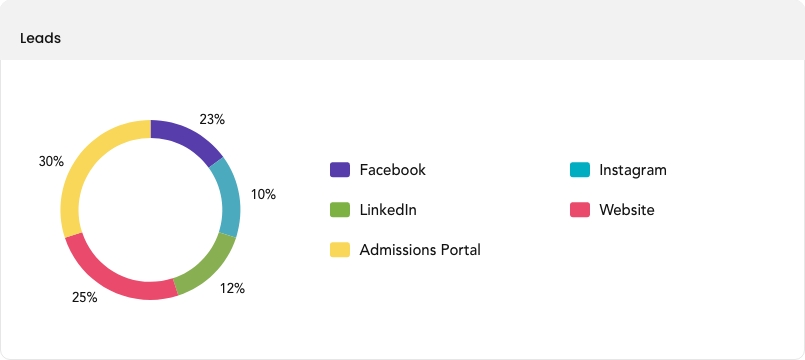
Lead by Source: A pie chart indicating the
Lead Source.
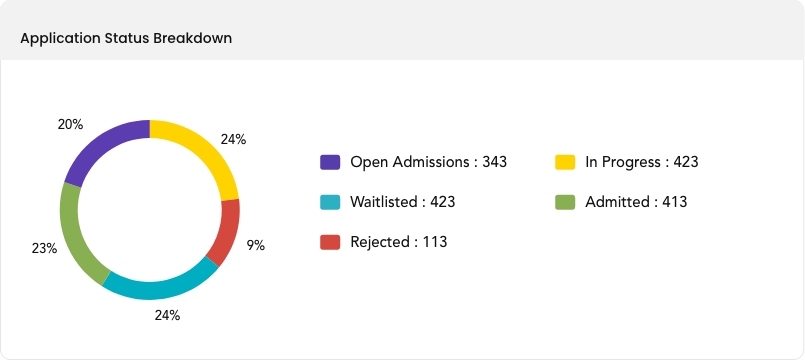
- Lead by Status: A pie chart displaying the
Lead Status.
- Lead Wise Program Enrollment: A bar chart showing the number of leads per per program.
- Counselor wise Leads: A bar chart showing the number of leads handled by each counselor.

- Program Wise Enrollment: A bar chart comparing the number of enrolled students in each program.

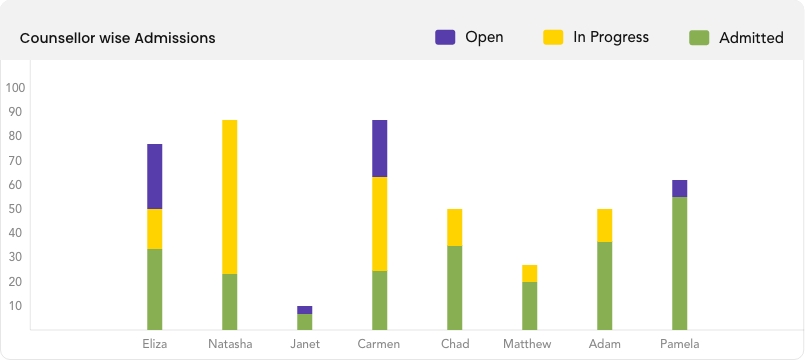
- Counselor wise Admissions: A bar chart showing the number of leads converted into admissions by each counselor.
- The Admissions Team can filter the Admissions Metrics using the
select batchbutton to view current and previous admission details. - The Admissions Team can filter the
Lead Report(Lead by Day) by selecting the respective Month and Year. - The Admissions Team can contact the EnrollX implementation team for any new reports required in the admissions.
For additional support, you can raise a ticket about Admissions Dashboard by clicking on this link EnrollX Support.
Utility of Metrics and Visual Data Representations:
Walk-in Leads:
- Total Walk-in Leads Today: Assists in understanding the immediate engagement and interest level of prospective students on a daily basis.
- Total Walk-in Leads: Aids in evaluating the effectiveness of on-campus events and outreach over time.
Leads:
- Total Leads Today: Offers a quick snapshot of daily marketing and outreach performance.
- Total Leads: Reflects the overall success of the institution's lead generation efforts.
- Leads Converted (Moved to admissions): Indicates the efficiency of the admissions process in converting interested candidates into enrolled students.
- Junk Leads: Helps in assessing the quality of lead generation channels and refining marketing strategies.
Admissions:
- Total Admissions Today: Provides immediate data on how many students are being admitted, allowing for responsive resource allocation.
- Total Admissions: Offers long-term insight into admissions trends, essential for strategic planning.
- Admissions Open: Shows the workload and potential pipeline for the admissions team.
- Total Admitted: Helps to measure the conversion rate and success of the admissions strategy.
Visual Data Representations:
- Lead Report by Day: This line graph provides a visual trend of lead generation, helping identify patterns or anomalies in daily leads, possibly influencing marketing tactics.
- Lead by Source: The pie chart breaks down the proportion of leads by their sources, highlighting the most effective channels for engagement.
- Lead by Status: Another pie chart categorizes leads by their current status in the admissions funnel, offering insights into the pipeline's health and potential follow-up actions.
- Lead Wise Program Enrollment: Displays the distribution of leads across different programs, which can inform program marketing strategies and capacity planning.
- Counselor wise Leads: Illustrates the performance of individual counselors, which can be used for training, resource allocation, and recognizing outstanding work.
- Program Wise Enrollment: Compares actual enrollment figures across programs, helping to identify trends and inform program development and marketing.
- Counselor wise Admissions: Shows the success rate of counselors in converting leads to admissions, providing a basis for performance evaluation and potential incentives.
Support and Assistance
For any additional support or questions regarding the Admission Dashboard feature, please consult our CampX Support Docs for detailed guides and FAQs. The EnrollX support team is also available to provide personalized assistance, ensuring you can fully utilize the capabilities of the CampX platform for your admissions needs. For guidance or queries, access our support docs via CampX Support Docs.